DoubleLoop changelog
🚀 Major Updates

🔄 AI Reports UX Redesign
Revamped the AI Reports UI for a smoother experience.
Improved mobile responsiveness and added a count badge.
📊 Simulation Enhancements
Added a Populate Baselines button using AI for metric simulations.
Baselines now live-update from AI population, ensuring real-time accuracy.
Improved error handling for simulations to prevent invalid values.
🎨 UI/UX Improvements
Improved UI consistency & color customization across components.
Brought color back into our lives. Added border colors for cards based on type.
Adjusted populate button coloring for better visibility.
🧠 AI Updates
AI Builder fixes – corrected card directions for input and output metrics.
Upgraded AI map data handling – moved from
playbook.jsonto a more flexible Markdown-based format.
🐛 Bug Fixes
Removed unused fieldset legends in reports.
General cleanup & UI fixes for better performance.
🔗 Integrations
Comments can now be sent to Slack when configured, improving team collaboration and visibility.
Connected a new AI-pipeline-specific queue for improved request handling.
🛠 Miscellaneous
Removed Work data settings tab, replacing it with direct input fields for better usability.
🚀 New Features & Enhancements

Major themes have been around infusing AI at the core of the product and improving bulk import of metrics.
Note! We are getting caught up on our changelog. Relaunching it on ProductLane. This is a pretty large step for us as we shed outdated functionality (Changelogs) that no longer makes sense to our product strategy.
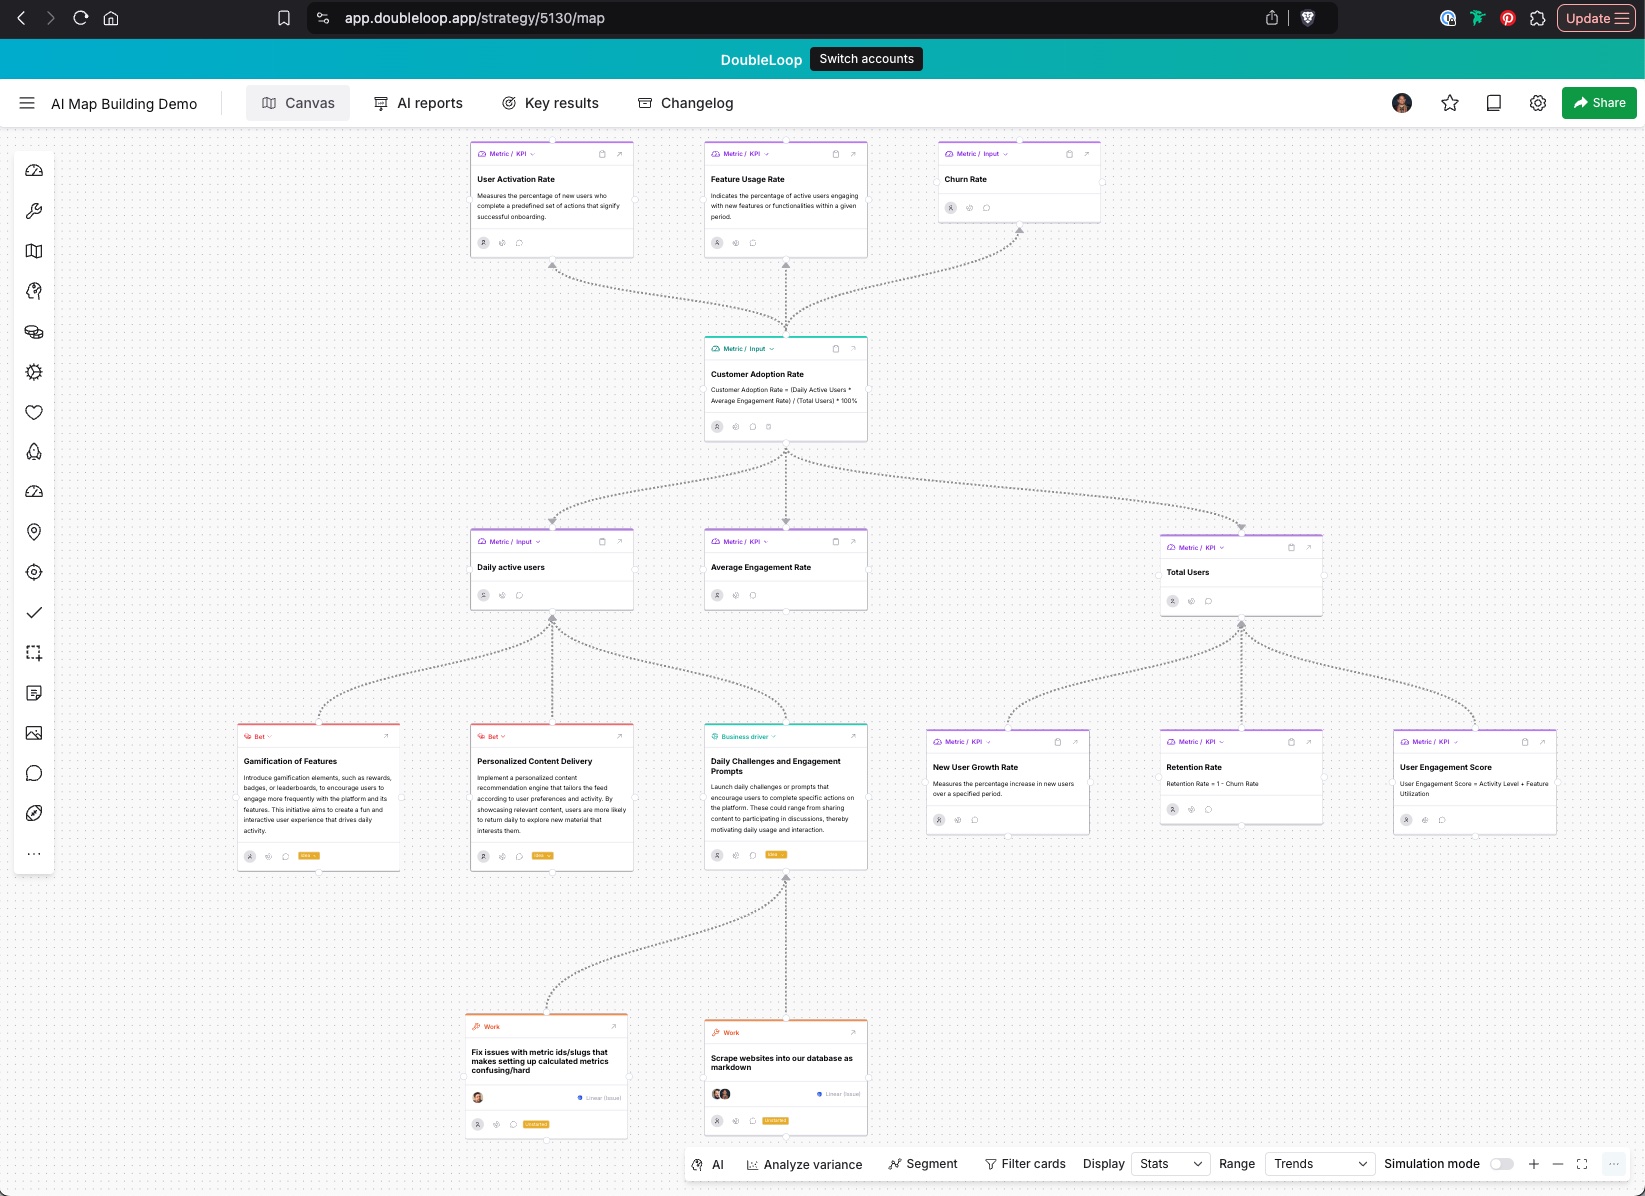
🌎 AI Map Building V1
We have launched a number of new tools including a beta release of a Strategy Context Chat that gathers and guides users through educating our system on how their business works. This context is then used for all the other AI Map Building and analysis features.
Cards now have the ability to AI generate contextual Input Metrics, Business KPIs, and an experimental mathematical formula breakdown into a Calculated Metric.
This is just the beginning! We're taking a major UX pass at how to expose all the functionality much more clearly to rapidly build a Value Architecture map for your business.
AI Reports
A first version of our AI Reporting Dashboard that can use the full context of the strategy map to generate reports. This is useful for staying on top of trends in your data, anomaly detection, and a myriad of other usecases.
Other Improvements
AI & Map Improvements
Live cursors now track user presence on maps.
Nodes without handles will no longer crash the map.
Improved AI chat auto-scroll behavior with a way to return to the bottom.
Strategy Map sharing moved to a standalone dialog and easier to find.
Added metric context chat + formula breakdown features.
Improved Metric Source Management
Redesigned the CSV upload flow to allow mapping columns rather than forcing a file layout.
Allow adding Looker dashboards as a multi-metric integration.
Users can now modify multiple segments before applying them.
Show a toast when a metric ID is copied from the node toolbar.
Allow switching the stat display on metrics between numbers and sparklines.
Provide better error output for Amplitude sources.
Added a bookmarklet for quickly grabbing Amplitude dashboard chart URLs for import.
User Experience & Interface Updates
Improved list filtering and entity creation workflow.
Updated the new version alert to better match the new styles.
Changed map copy ID button back to the word "ID" instead of a copy icon.
Small UI/UX tweaks to unify the interface.
Added a tooltip to import status/task items for better clarity.
Made metric source results window compatible with dark mode.
Prevent auto-navigation when updating a metric or entity from the settings tab.
Show an indicator when a headline/title is edited with remote updates disabled.
Improved form submission flows for organizations.
🛠️ Bug Fixes
Updated AI chat window resizing behavior to prevent breaking in empty states.
Fixed the AI panel displaying duplicate buttons and error text.
Fixed the drag-and-drop highlight behavior.
Fixed metric correlations erroring on certain configurations.
Prevented correlation page flashing on updates.
Fixed missing metric stats in autocomplete cards.
Ensured AI content lists render properly.
Fixed broken AI PDF reading.
Fixed Google Sheets button hot fix.
Fixed collapsed card toolbar positioning.
Fixed calculated metric history imports.
Fixed metric data point list sorting to stabilize display.
Prevented key results spacing from hiding the delete button.
Fixed the AI chat window breaking when resized in an empty state.
Fixed metric source import process for better performance and reliability.
Prevented assumptions that a user is logged in when using maps.
Disabled background gradient when an image is present to avoid overlay issues.
🔄 General Improvements
Improved calculated metric imports.
Improved the stability of metric source jobs.
Improved strategy list delete button functionality.
Ensured deterministic metric creation.
Maintained parent/child relationships in copied nodes.
Increased file upload timeout from 10 seconds to 10 minutes.
Improved error handling for metric source activity logs.
Improved regression variance reporting.
Enhanced historical importing of calculated metrics.
Improved entity drawer list formatting.